[1] Home
Last modified by admin on 2023/07/04 11:17
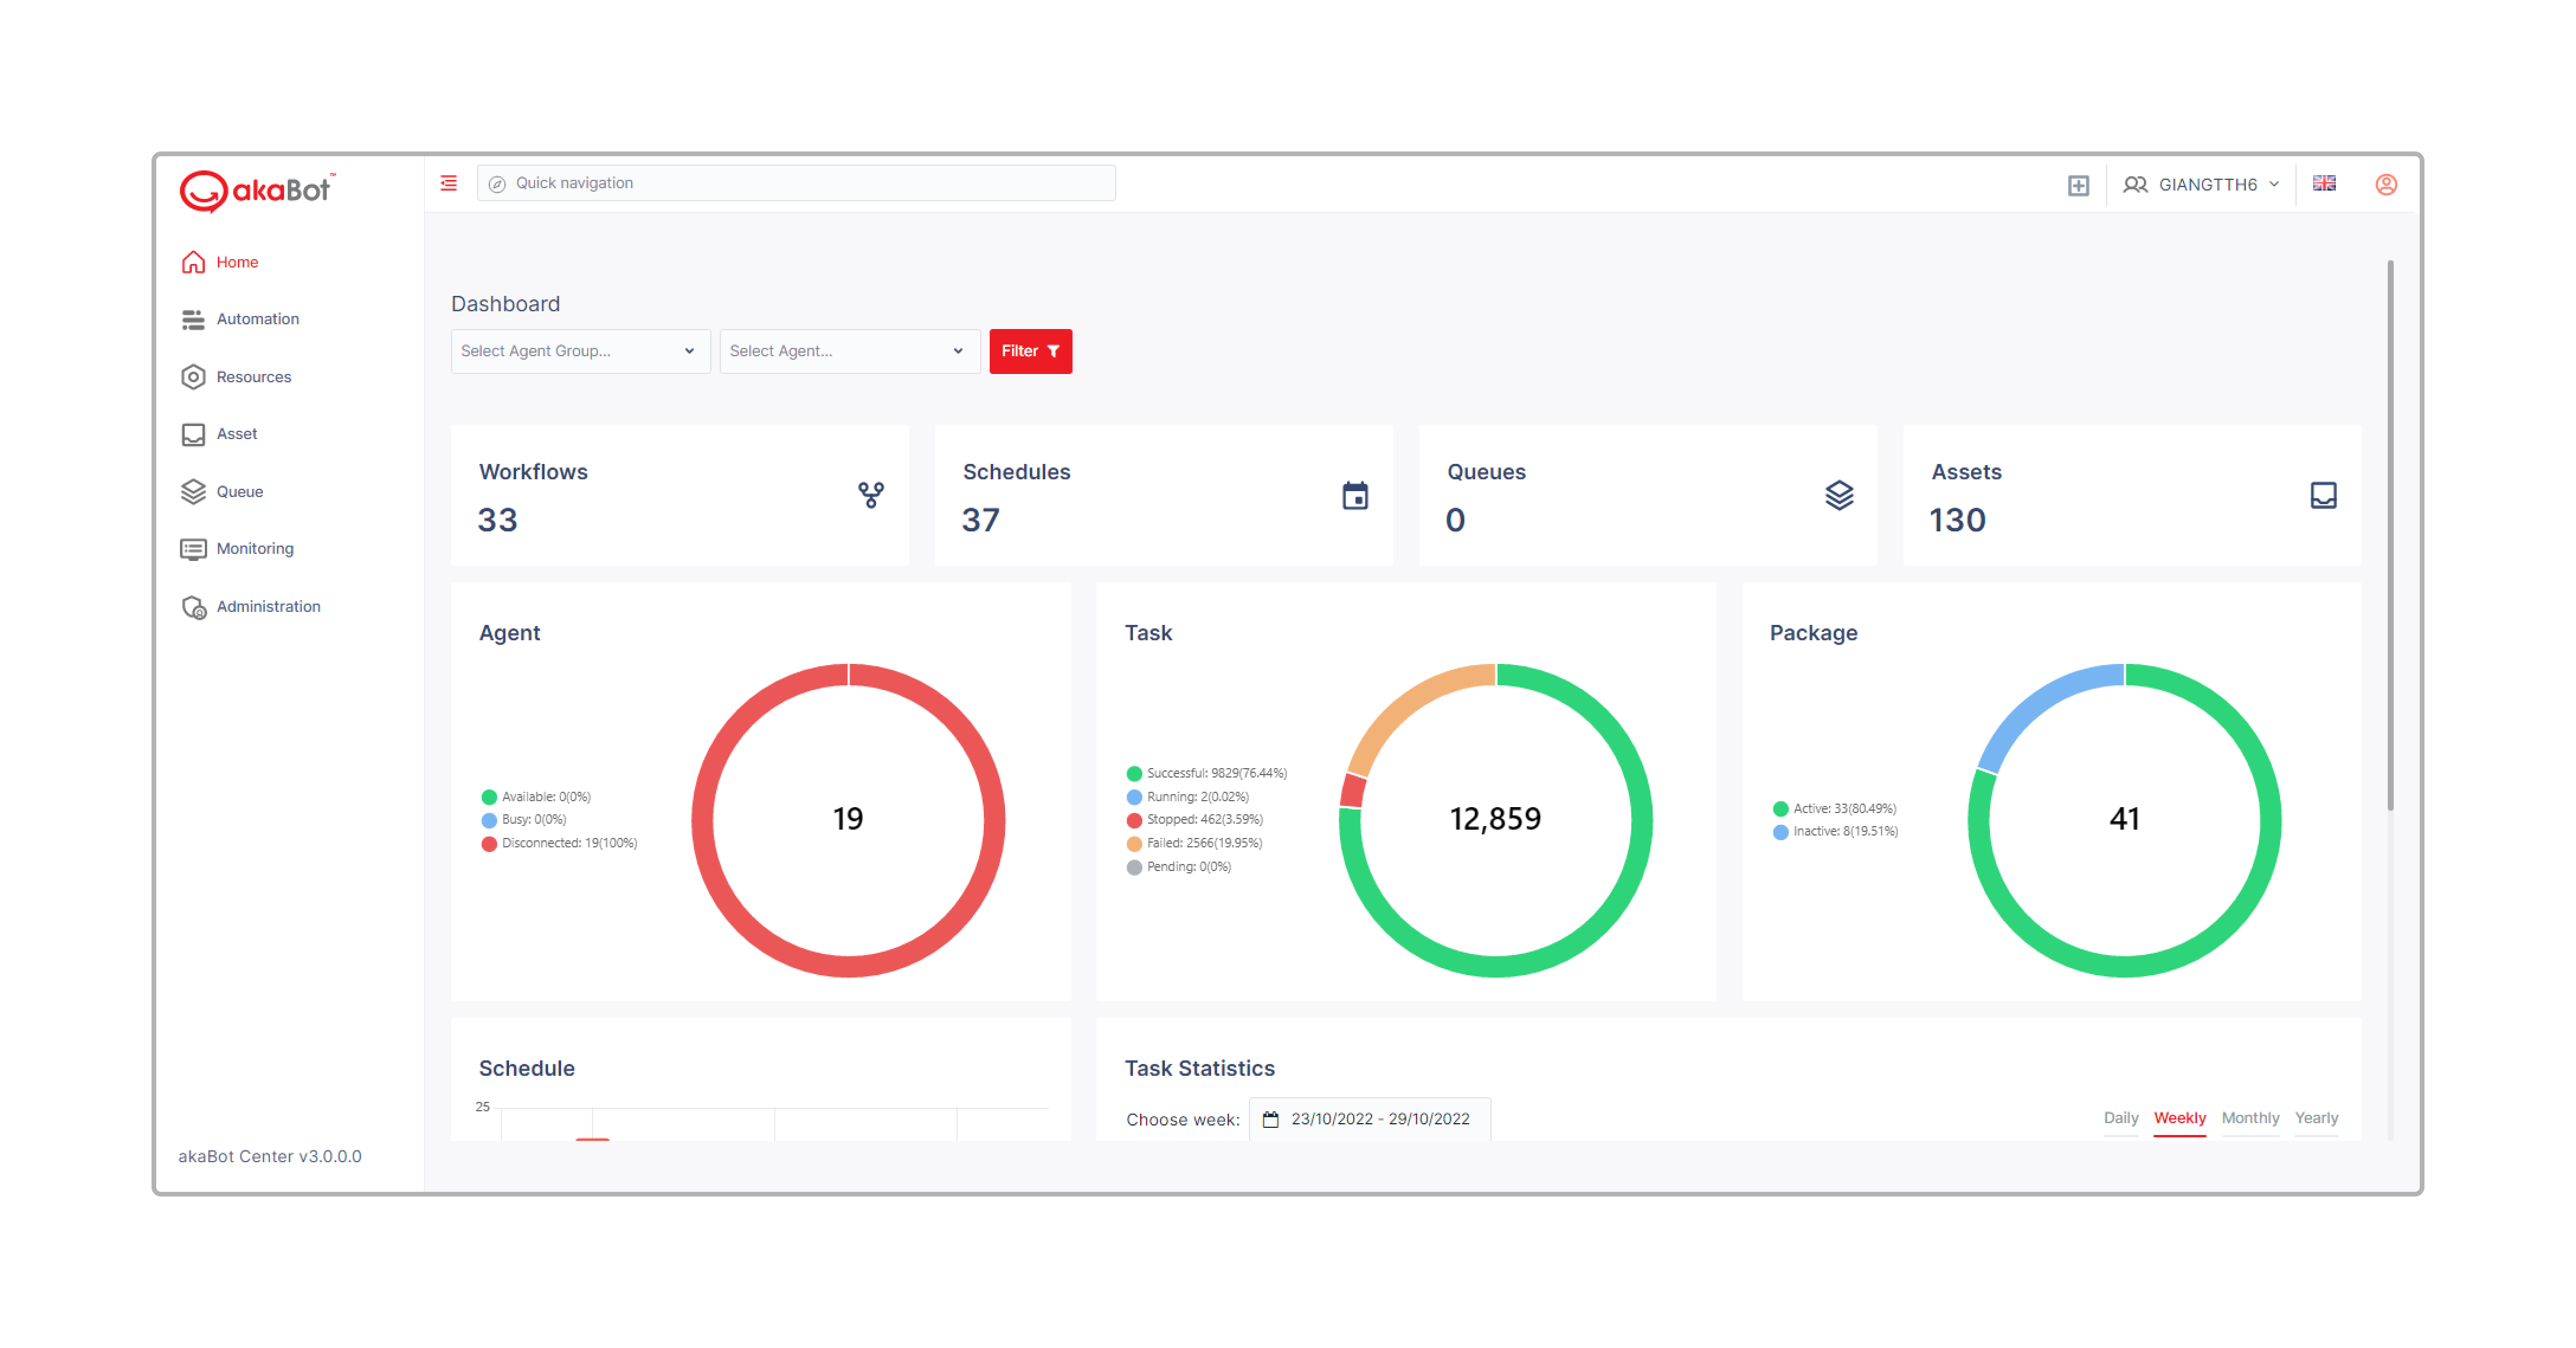
akaBot's home page is a dashboard that enables you to see all the statistical charts of a single Organizational Unit containing useful information for all the following components:
- Number of Agent (Available, Busy, Disconnected, Nonresponse)
- Number of Task (Successful, Running, Stopped, Faulted)
- Schedule (Calculated by Hour, Day, Week and Month basis)
- Package (Active, Inactive)
- Task Statistics (Daily, Weekly, Monthly, Yearly view available)
- Upcoming Tasks
- Recent Tasks
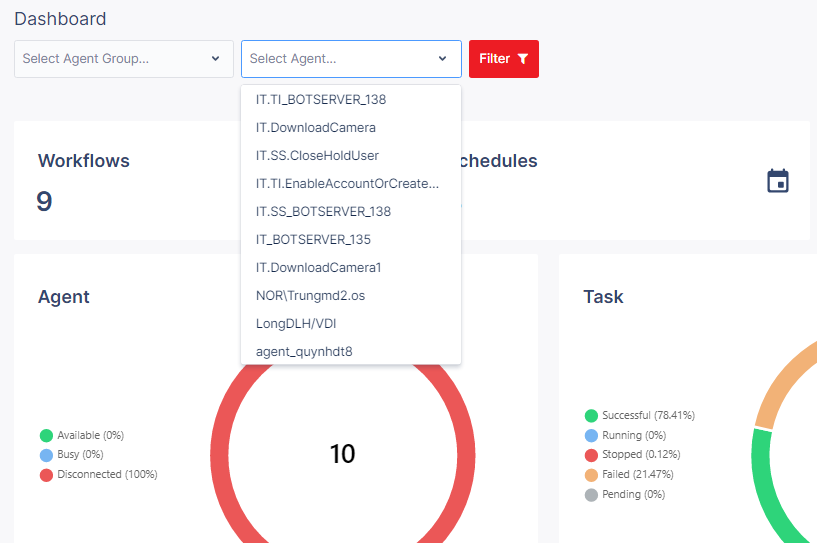
You can filter the data based on the Agent Group and Agent Name
| No | Column/Label | Description | Type | Maximum | Input Requirement |
|---|---|---|---|---|---|
| 1 | Select Agent Group | Select the agent group of which you want to see statistics | Input searching | No limit (2,147,483,647 char) | |
| 2 | Select Agent | Select the agent of which you want to see statistics | Input searching | No limit |
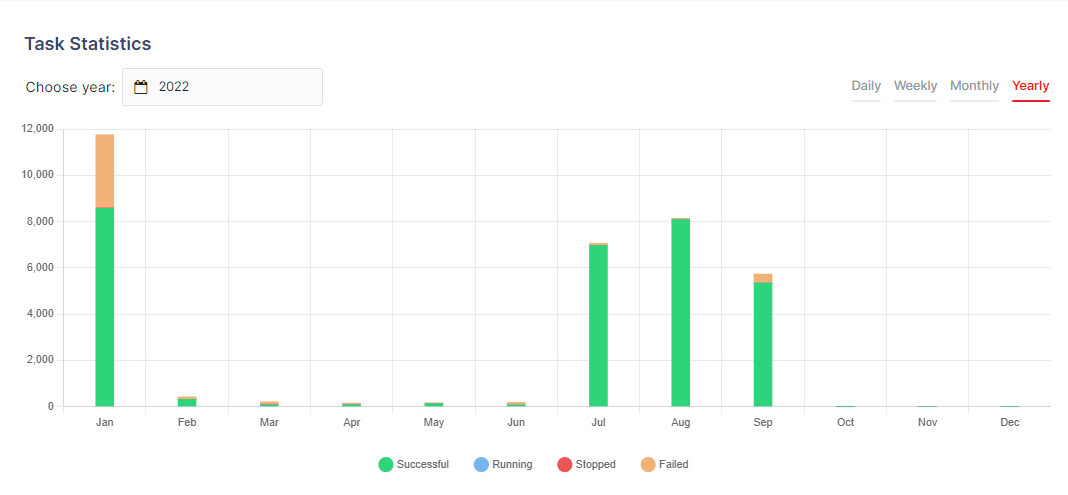
You can also view the Task Statistics by selecting the corresponding tab: Daily, Weekly, Monthly, Yearly.
| No | Column /Label | Description | Type | Maximum | Is Mandatory ? | Input Requirement |
|---|---|---|---|---|---|---|
| Daily / Weekly / Monthly / Yearly | Select the type you want to see task statistics | Tab | Yes | |||
| Choose Day | Select the day you want to see task statistics | Date & Time | Yes | Only available if you chose daily | ||
| Choose Week | Select the week you want to see task statistics | Date & Time | Yes | Only available if you chose daily | ||
| Choose Month | Select the month you want to see task statistics | Date & Time | Yes | Only available if you chose daily | ||
| Choose Year | Select the year you want to see task statistics | Date & Time | Yes | Only available if you chose daily |