Customize Dashboards
Creating New View
To create a new views, take the following steps:
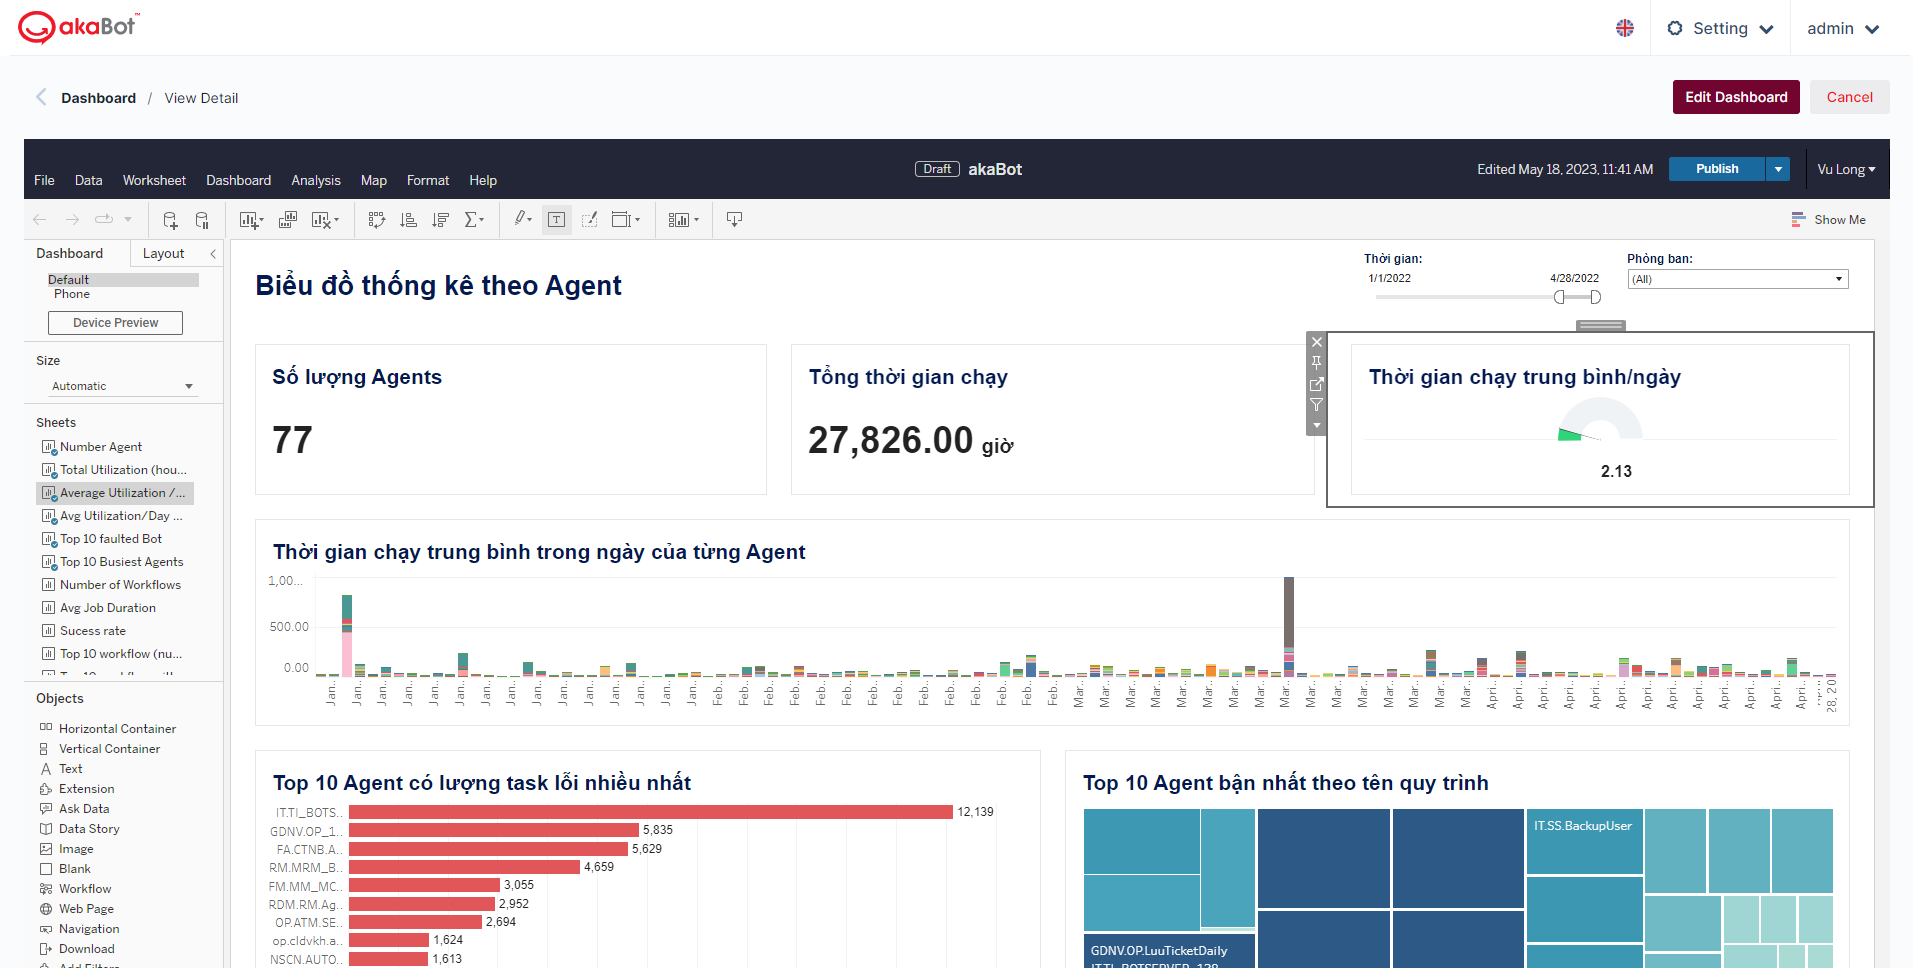
Step 1: Users click on Edit Dashboard in any view to access Tableau UI.
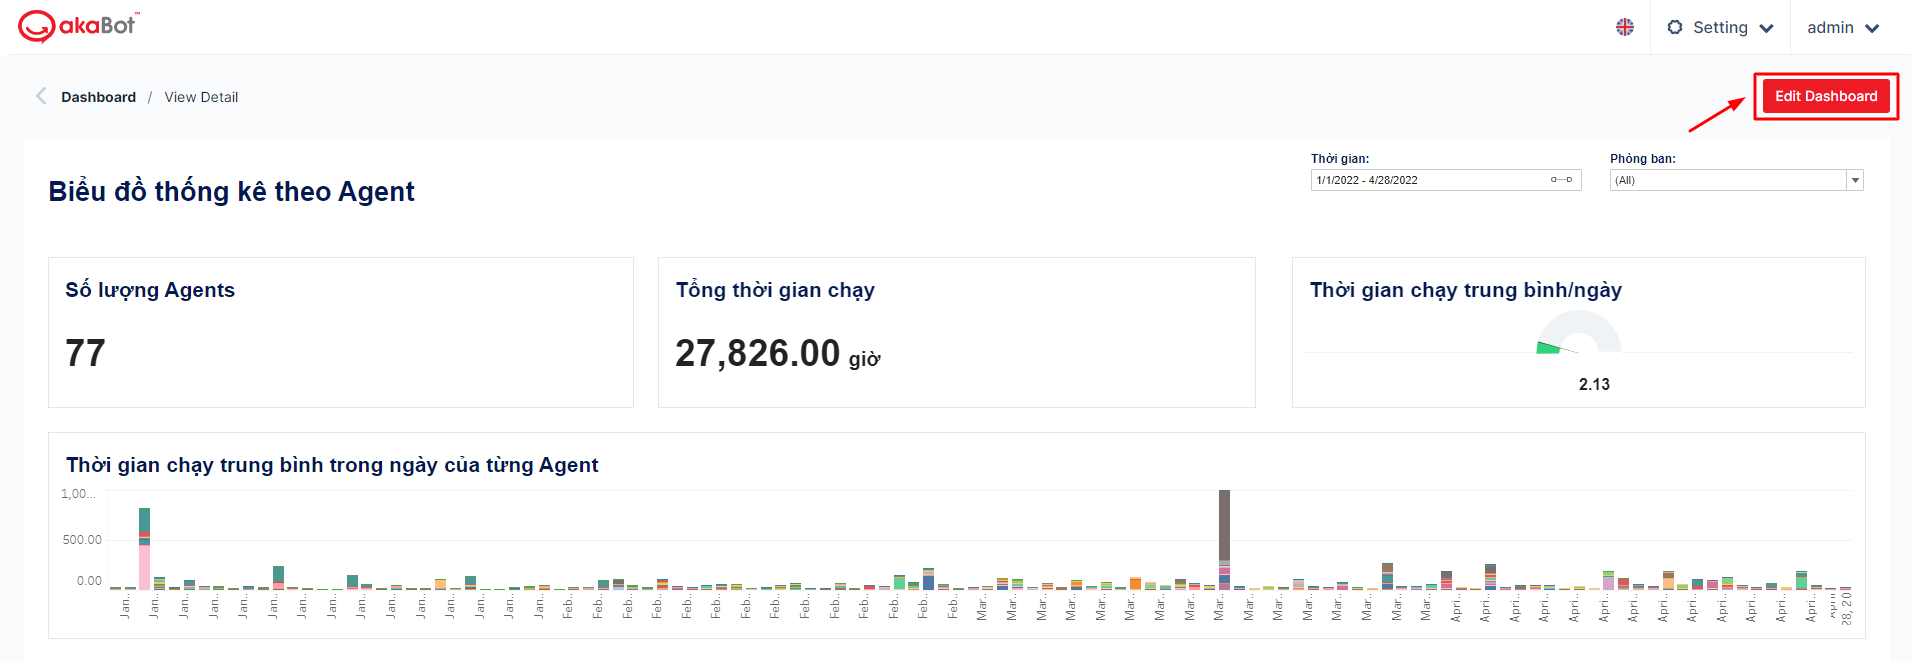
At this point, the screen will be switched to the view configuration screen of the embedded Tableau platform.
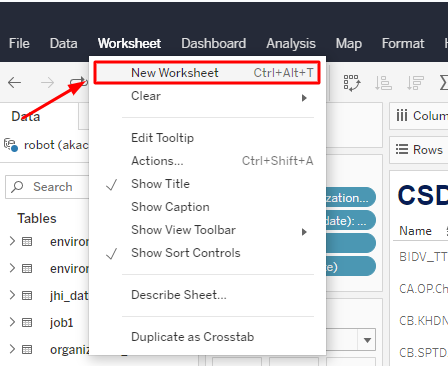
Step 2.1: To create a new worksheet, users can either click on the New Worksheet icon at the bottom of the page, or enter keyboard shortcut Ctrl + Alt + T.

Or click on Worksheet on the menu bar, then New Worksheet
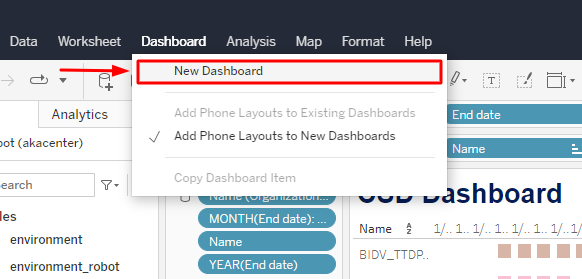
Step 2.2: To create a new dashboard, users click on the New Dashboard icon at the bottom of the page.

Or click on Dashboard on the menu bar, then New Dashboard.
Step 3: Click on Publish to save the new view to the list of views in akaBot Insights.

For detailed instructions on how to proceed next, we recommend reading Tableau’s guides for creating dashboards, found below.
The following pages help you create dashboards through the Tableau UI:
- Tableau Learning: It provides users with the fundamental knowledge and how to use Tableau.
- Tableau Documentation: It provides official Tableau documentation and instructional materials.
- Tableau Gallery: The Tableau Gallery is a place where you can learn how others design dashboards. It primarily focuses on learning about ideas, design techniques, and combining different types of charts.
- Tableau Viz Cookbook: A compilation of 52 different types of charts ranging from the most basic ones.
- Tableau Chart Catalog: A compilation of 100 basic to advanced types of charts, including a wide range of creative charts to serve various purposes.
Duplicating Views
To duplicate a view, take the following steps:
Step 1: Users click on Edit Dashboard in any view to access Tableau UI.
Step 2: Right-click on the sheet you want to duplicate, then click Duplicate.
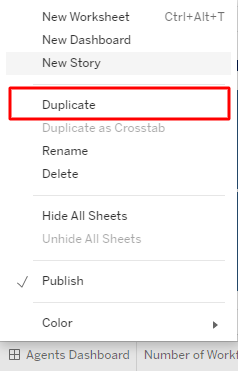
Step 3: Click on Publish to save the duplicated sheet to the list of views in akaBot Insights.
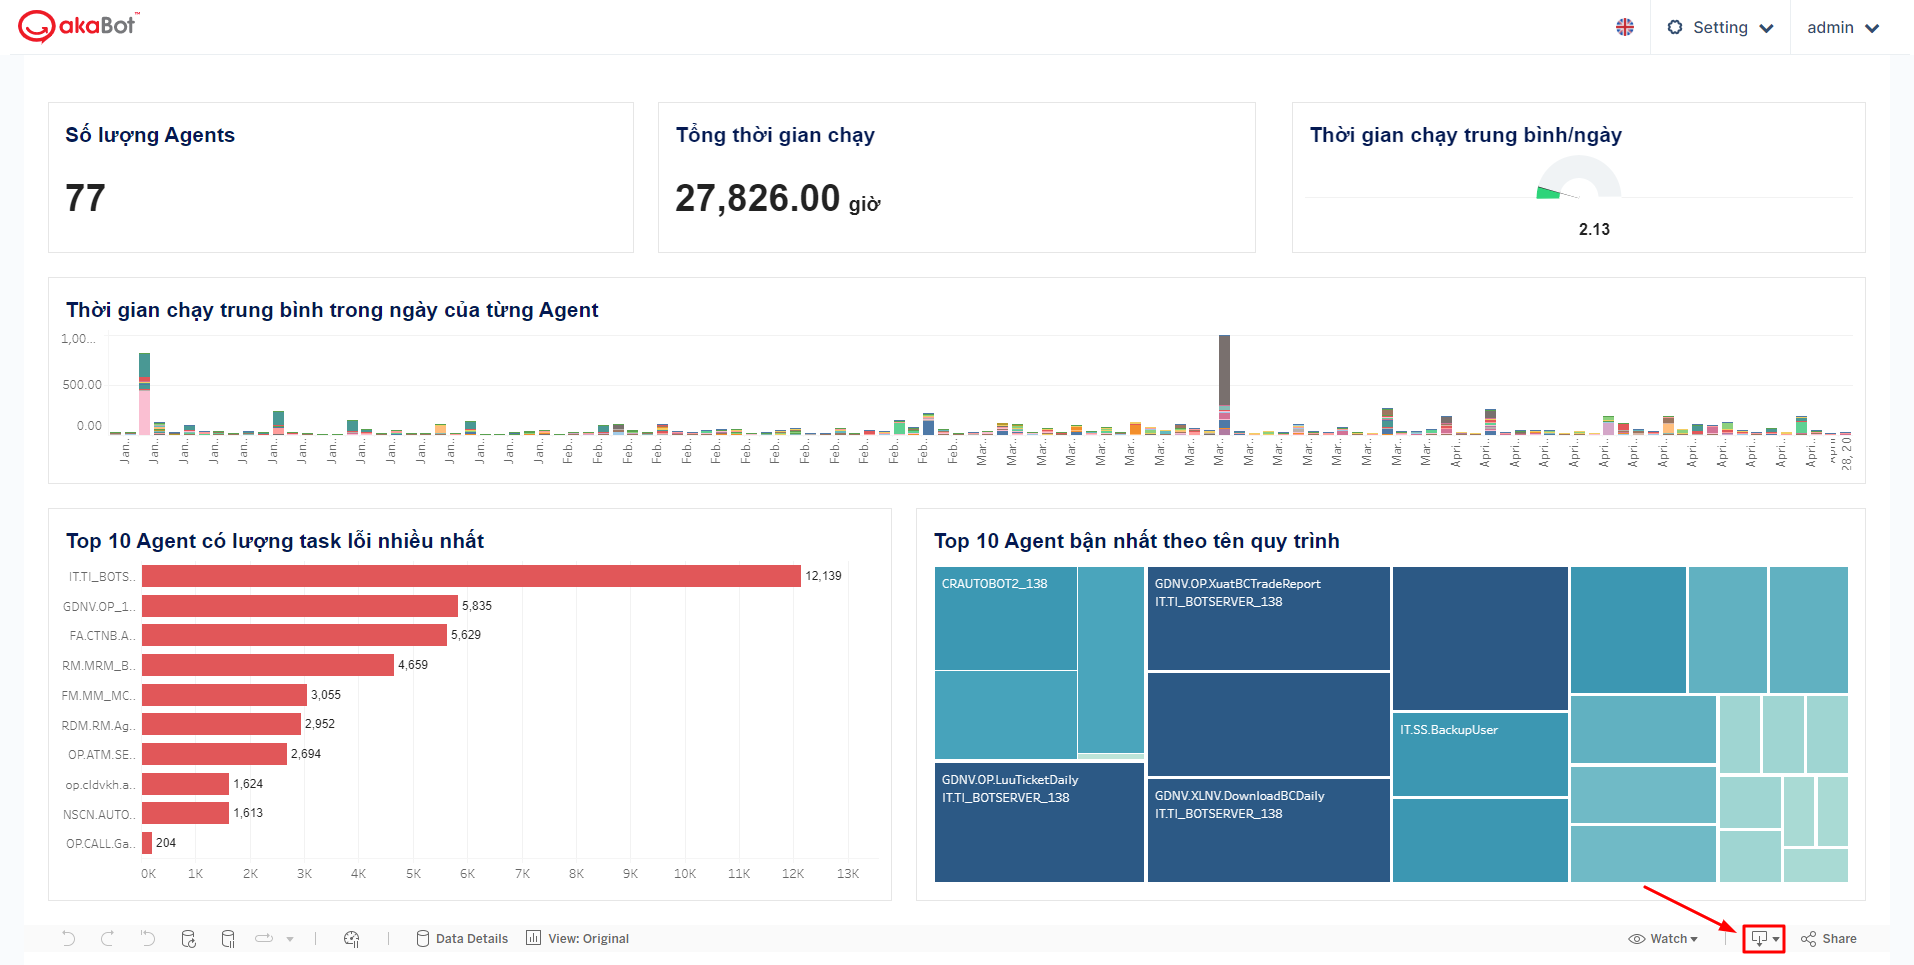
Exporting Views
Users can export the visualization in different formats: as a PDF file, as an image file, as a CSV file, as an Excel file, or as a PowerPoint file.
Step 1: To export a view, click on the Download icon
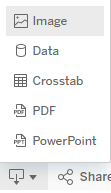
Step 2: Choose the file format you want to download.
Deleting Views
Views that are deleted on the akaBot Insights UI will not be completely removed but will be saved on the Tableau site.
To completely delete a view, you can follow these steps:
Step 1: Users click on Edit Dashboard in any view to access Tableau UI.
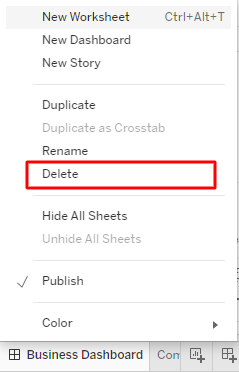
Step 2: Right-click on the sheet you want to duplicate, then click Delete.
Create and Edit your own dashboards
In addition to using the templates, you can customize your dashboard according to your preferences.
Note: To become proficient in creating/editing dashboards, please refer to the Tableau Documentation (the embedded platform of akaBot Insight).