As a manager or administrator, users may want to know about, for instance, all the documents imported to a specific queue or which data fields required the most corrections. The dashboard’s reports could also help employees process documents more effectively and efficiently.
In this article, we will show you how to use the Dashboard.
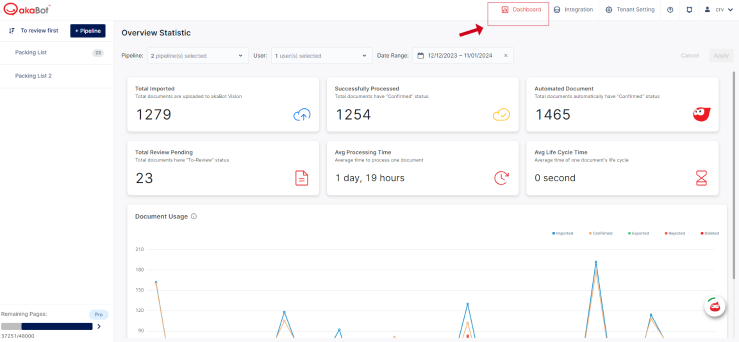
Firstly, user can access the Dashboard by choosing "Dashboard" on the top menu bar.
Now, we will introduce akaBot Vision's charts and their meanings
1. Total Imported
This statistic shows the total number of documents uploaded to akaBot Vision in the date range.
2. Successfully Processed
This statistic shows the total number of documents having "Confirmed" status.
4. Automated Document
This statistic shows the total number of documents that are imported to akaBot Vision and moved straight to the "Confirmed" tab
5. Total Review Pending
This statistic shows the total number of documents that have "To-review" status and need to be reviewed by users.
6. Average Processing Time
This statistic shows the average time that documents are moved from "To-review" status to "Confirmed" status
It will be calculated by the formula:
Average Processing Time = Time that documents move from "To-review" status to "Confirmed" status / Total documents
7. Average Life Cycle Time
This statistic shows the average time that documents are moved from "To-review" status to "Exported" status
It will be calculated by the formula:
Average Life Cycle Time = Time that documents move from "To-review" status to "Exported" status / Total documents
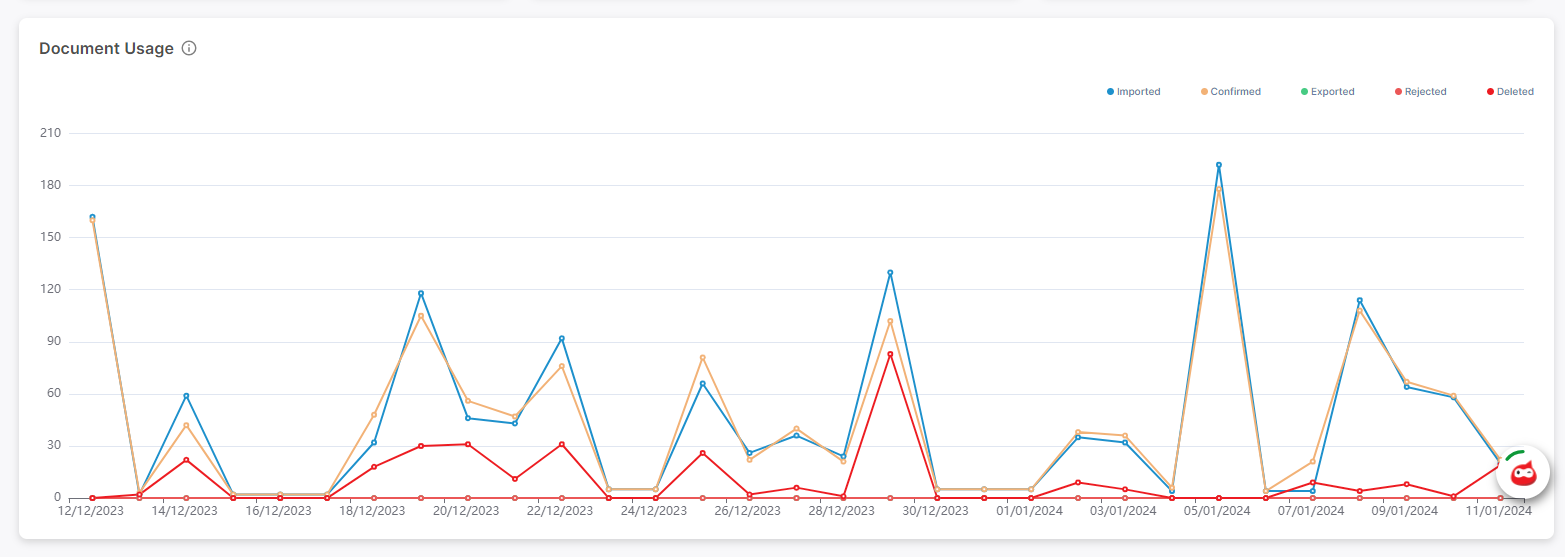
8. Document Usage
Tracking throughput is important when analyzing the quantity of imported, exported, and deleted documents in a given period. The numbers at the top are totals that have accumulated during your selected date range. Below these numbers, the time series represent the quantities of imported, exported, and deleted documents within the user's date range.
As shown in the image below, the values on the x-axis represent time ranges as defined by a selected granularity.