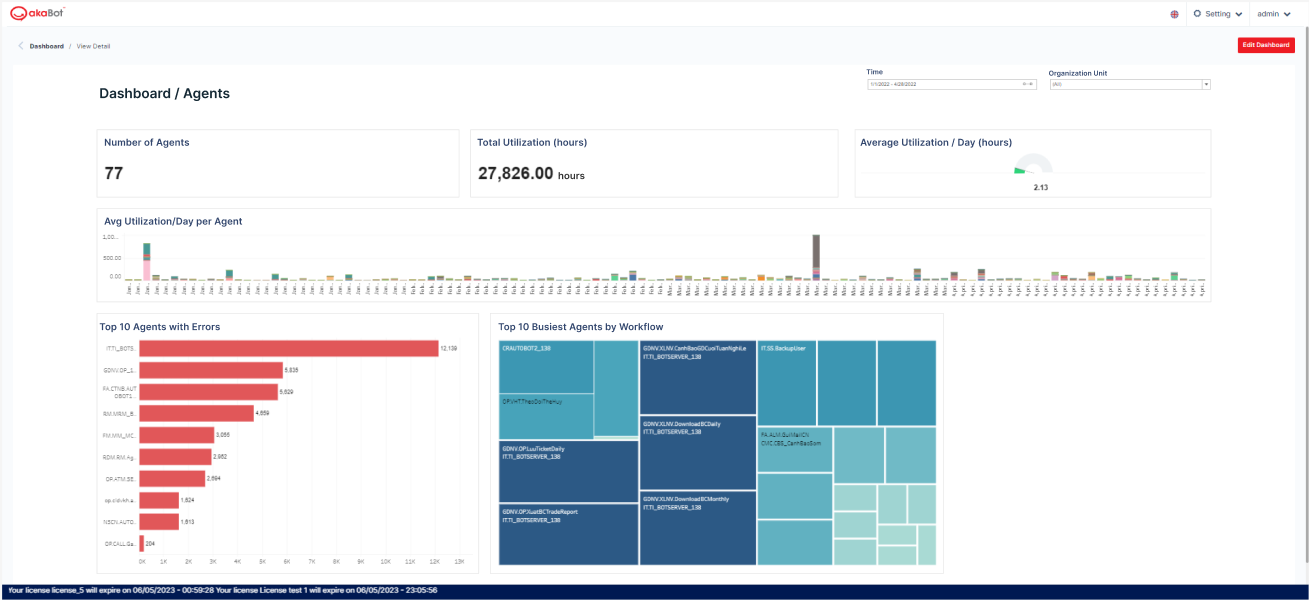
By default, the Agents dashboard is comprised of the following widgets, which can be edited:
Widget Name | Widget Type | Description | |
|---|---|---|---|
| 1 | Number of agent | Input | Total number of agent |
| 2 | Total Utilization | Input | The total utilization, in hours |
| 3 | Agent Utilization (per day) | Input | Average utilization in hours per day for agents. |
| 4 | Avg Utilization/Day per Agent | Column Chart | Average hours worked per day, for each agent. |
| 5 | Top 10 Agents with Errors | Pie Chart | The ten agents with the most errors. |
| 6 | Top 10 Busiest Agents by Process Name | Tree Map | The agents that spent the most time executing each process. |