By default, the Workflow dashboard is comprised of the following widgets, which can be edited:
Widget Name | Widget Type | Description |
|---|---|---|
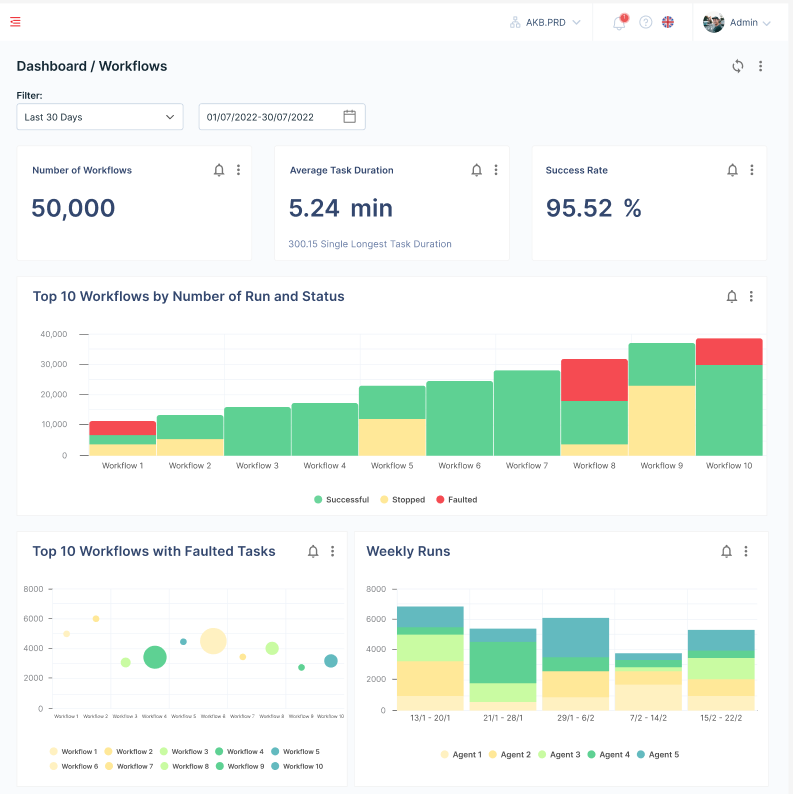
Number of workflow | Input | Cumulative total of all processes executed. |
Average Task Duration | Input | Displays the average job duration and the single longest job duration in seconds to minutes. |
Success Rate | Input | Displays the percentage of jobs with state successful and the total number of completed jobs. |
Top 10 Processes by # Run and Status | Tree Map | Displays each process by name, split by the number and status of all jobs for that process. |
Top 10 Processes with Faulted Jobs | Scatter Chart | Displays the top 10 processes with the most faulted jobs. |
Weekly Runs | Column Chart | The number of execution per week for each robot. |