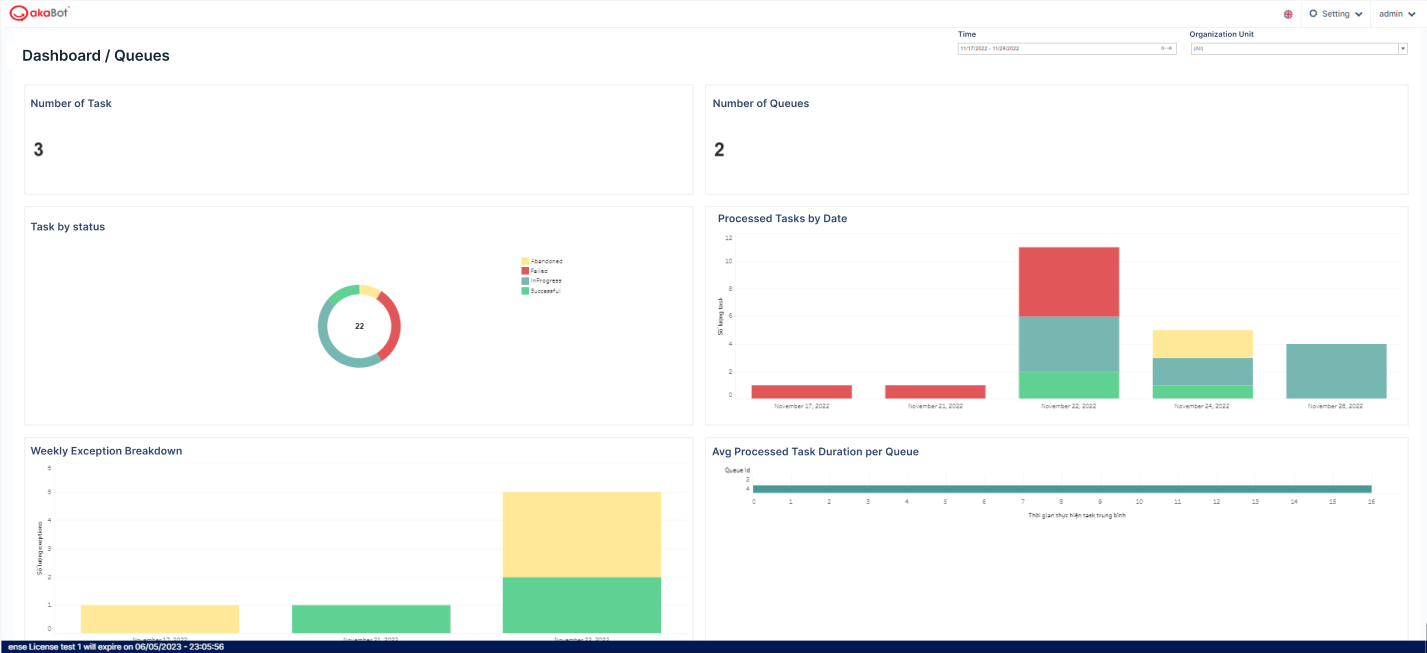
By default, the Queues dashboard is comprised of the following widgets, which can be edited:
Widget Name | Widget Type | Description |
|---|---|---|
Number of task | Input | Displays a cumulative total of all tasks processed to date. |
Queues | Input | The total number of queues. |
Task by Status | Pie Chart | The total number of tasks, including retried tasks, for each state:
|
Task by Date | Column Chart | The total number of task per day, with a breakdown by Successful and Failed status. |
Weekly Exception Breakdown | Column Chart | Total number of exceptions for each week, with a breakdown by exception type: ApplicationException or BusinessException. |
Avg Task Duration Per Queue | Bar Chart | Displays the average handling time, in seconds, for each item per queue. |